
The Six Roads That Quietly Lead You Into Insulin Resistance
How to match your labs & symptoms to the pattern behind your insulin resistance.

Last week I wrote a note about glucose and explained that a glucose monitor never gives the whole truth. People rarely measure insulin itself. Most never test it. And when they finally do, nobody explains what the number means or what is driving it up. A patient walks in with high fasting insulin and the response they get sounds the same every time. Eat less. Move more. Cut carbs. That message gets repeated until people believe high insulin is the main cause of their weight gain, inflammation, and metabolic decline.
When you look at how the body produces and uses energy, this logic falls apart. High insulin does not appear out of nowhere. It is a secondary adaptation. A signal that something upstream is creating friction. After I posted that note many people reached out and asked the same thing: How do I know what is pushing MY insulin up? This question matters because high insulin is a shared endpoint. Several different internal pressures can produce the same number.
If you do not identify your driver, you end up guessing. Most guesses make things worse.
This article breaks down the most common drivers and shows how each one appears in labs, in body shape, in sensations, and in the way you feel day to day. You will also get a quick sense of how to start fixing it and move in the right direction. Once you match your pattern, the whole picture sharpens. The body becomes readable again. And when you see the pattern, you know which levers to pull.
1. The Hepatic-Biliary Driver (The Sluggish Filter)
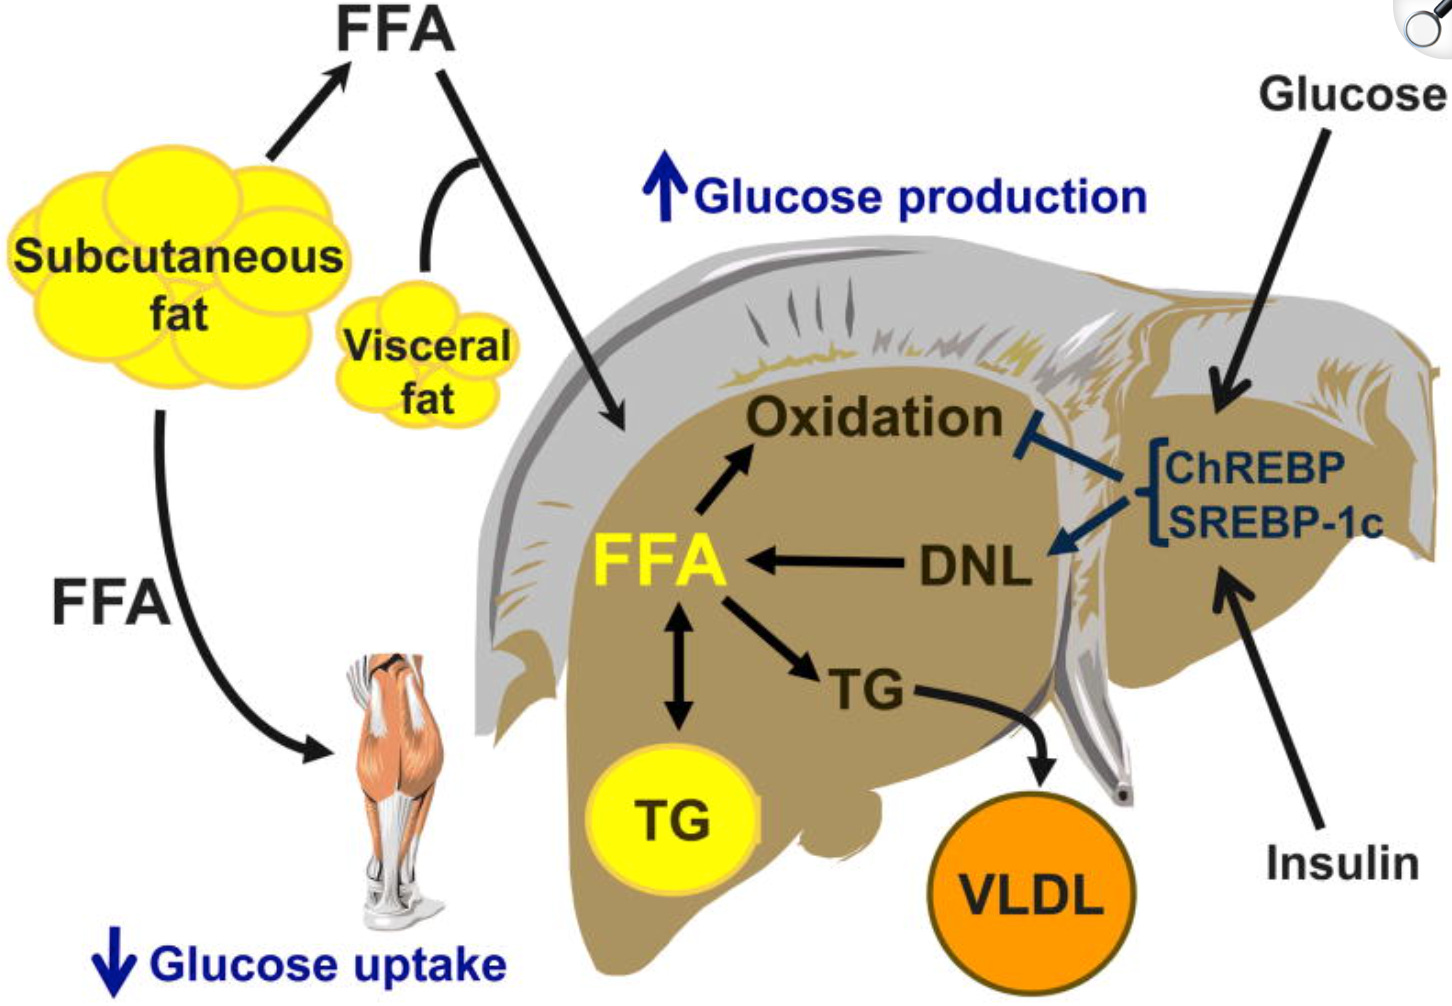
The liver is the primary site for clearing insulin from your blood. If the liver is preoccupied with detoxifying Endotoxins (LPS) leaking from a stressed gut, or if it is “congested” with polyunsaturated fats (PUFAs), it cannot clear insulin effectively. Insulin stays in the blood longer, and the body loses its ability to switch between burning sugar and fat.
PUFA, particularly omega-6 linoleic acid from seed oils, accumulate in cell membranes and adipose tissue. These fatty acids are highly susceptible to lipid peroxidation, generating reactive oxygen species and inflammatory metabolites. High dietary omega-6 to omega-3 ratios promote insulin resistance.
The Lab Cluster:
• Fasting insulin 10 to 25+ µIU/mL
• Triglycerides above 100 mg/dL
• TG to HDL ratio above 2.0
• GGT in the upper third of the range
• HDL low
• ALT or AST slightly elevated
• Fasting glucose normal to slightly elevated (85 to 105 mg/dL)
• Uric acid often elevated
The Body Map:
• Increasing waist circumference
• Normal BMI with growing central adiposity
• Visceral fat accumulation
• Can occur in lean individuals
Symptoms and Sensations:
• Right upper quadrant discomfort or fullness
• Fatigue after meals, especially high-fat meals
• Difficulty digesting fats
• Skin issues such as acne or seborrheic dermatitis
Correction Path:
Remove seed oils (PUFA). Replace them with saturated fats like coconut oil or butter.
Use daily raw carrot salad to bind endotoxin and reduce the load on the liver.
Include choline from eggs to support hepatic fat clearance.
Add light movement after meals.
Follow the bile protocol described in this article if you need deeper guidance. Improving bile flow reduces liver stress, lowers endotoxin load, clears stored fats, and restores the liver’s ability to clear insulin.

2. Thyroid-Driven Insulin Resistance
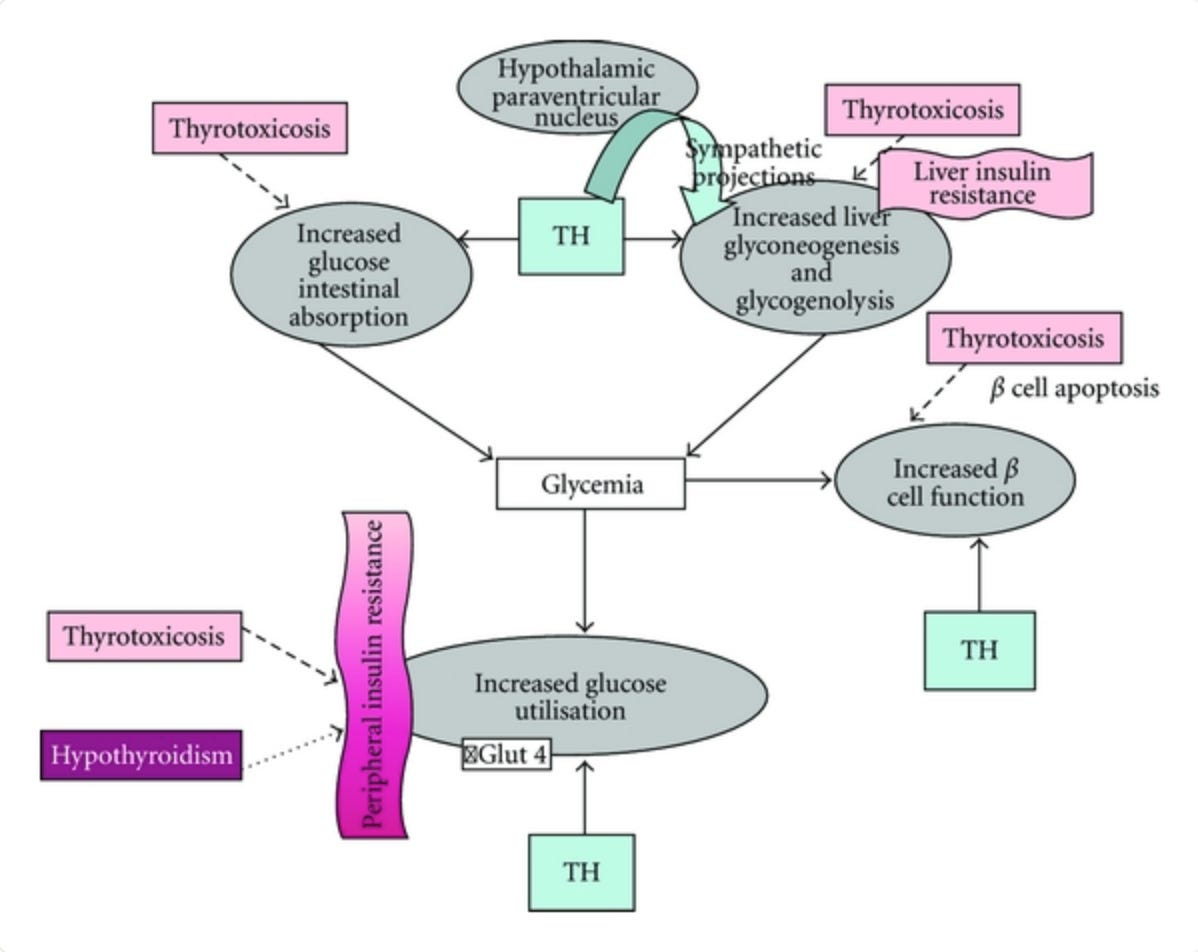
Low thyroid output slows glucose oxidation. Active thyroid hormone (T3) is the master key to the cell. It regulates the enzyme pyruvate dehydrogenase, which allows glucose to enter the mitochondria and be burned for energy. When T3 is low, the door to the mitochondria feels locked. Glucose cannot be used efficiently. The body compensates by raising insulin to force glucose into cells. Studies show that insulin resistance and diabetes are associated with reduced conversion of T4 to T3 and increased production of reverse T3, the inactive form. This creates a vicious cycle. Low T3 impairs insulin sensitivity. Rising insulin further interferes with thyroid conversion. Metabolism downregulates, energy expenditure drops, and the body becomes increasingly insulin resistant while simply trying to maintain basic function with insufficient metabolic drive.
Research also shows that even in euthyroid individuals, with “normal” TSH, low-normal T4 and T3 within the reference range correlate with higher insulin resistance. The actions of T3 on glucose metabolism are on the same order of importance as insulin itself. This is why you have to look at Free T3, Reverse T3, and body temperature, not just TSH.
The Lab Cluster:
• Fasting insulin 8 to 15+ µIU/mL
• TSH above 2.0
• Free T3 in the bottom 25 percent of the range
• LDL lower than expected
• Fasting glucose normal or slightly elevated
The Body Map:
• General puffiness in the face and ankles
• Reduced outer eyebrow density
• Gradual weight gain despite eating less
• Extreme fatigue, especially afternoon
• Slow muscle recovery
The Sensation:
• Chronically cold hands, feet, and nose
• Resting pulse often below 65 bpm
• Brain fog because neurons are under-fueled
• Constipation
• Slow, heavy mornings
• Bloating
• Hair shedding
• Fatigue, especially afternoon
• Low motivation, flat mood
Correction Path:
1. Eat enough calories and carbohydrates so the liver can convert T4 to T3
2. Salt your food to support thyroid hormone action in the tissues
3. Keep calories consistently higher for several weeks instead of “good” and “bad” days
4. Improve sleep quality and duration
5. Reduce training volume or intensity temporarily
6. Base your diet around nutrient-dense foods like dairy, fruit, eggs, gelatin, and cooked roots
7. For more information, medication and supplement options, see my thyroid article
3. The Adrenal-Stress Driver
Stress is metabolically expensive. The brain sends a signal of threat and cortisol rises to guarantee fuel for the brain. Cortisol breaks down muscle into glucose. It also makes your muscles temporarily insulin resistant, because the body preserves that glucose for survival tasks. This system works well in short blasts. Chronic stress turns it into a trap.
Visceral fat grows faster under cortisol. Visceral fat releases inflammatory cytokines that further interfere with insulin signaling. Cortisol suppresses thyroid conversion, which lowers metabolic rate and slows glucose oxidation. The body shifts into a state where it is alert, underpowered, and inflamed at the same time.
The Lab Cluster:
• Fasting insulin 10 to 20+ µIU/mL
• Morning cortisol upper-normal or elevated
• Low morning body temperature below 97.8°F
• Fasting glucose 85 to 105 mg/dL
• HDL often low
• Free T3 low or low-normal
• Reverse T3 often elevated
The Body Map:
• Weight gain in the upper abdomen (“cortisol belly”)
• Rounded facial appearance
• Thin arms and legs
• Loss of muscle or difficulty building muscle
The Sensation:
• Wired but tired
• Disturbed sleep
• A late-evening energy surge
• Waking at 3 AM with a racing heart
• Anxiety and irritability
• Blood sugar crashes between meals
Correction Path:
1. Eat frequent meals to stabilize the adrenal response
2. Increase carbohydrate availability
3. Use salt with evening carbs
4, Consume caffeine only with food
5. Eat a real breakfast
6. Lower training intensity. Stop HIIT. Switch to slow, leisurely walks to signal safety to your nervous system.
7. Improve sleep structure
8. See my anxiety and insomnia article for additional guidance
4. Inflammation-Driven Insulin Resistance
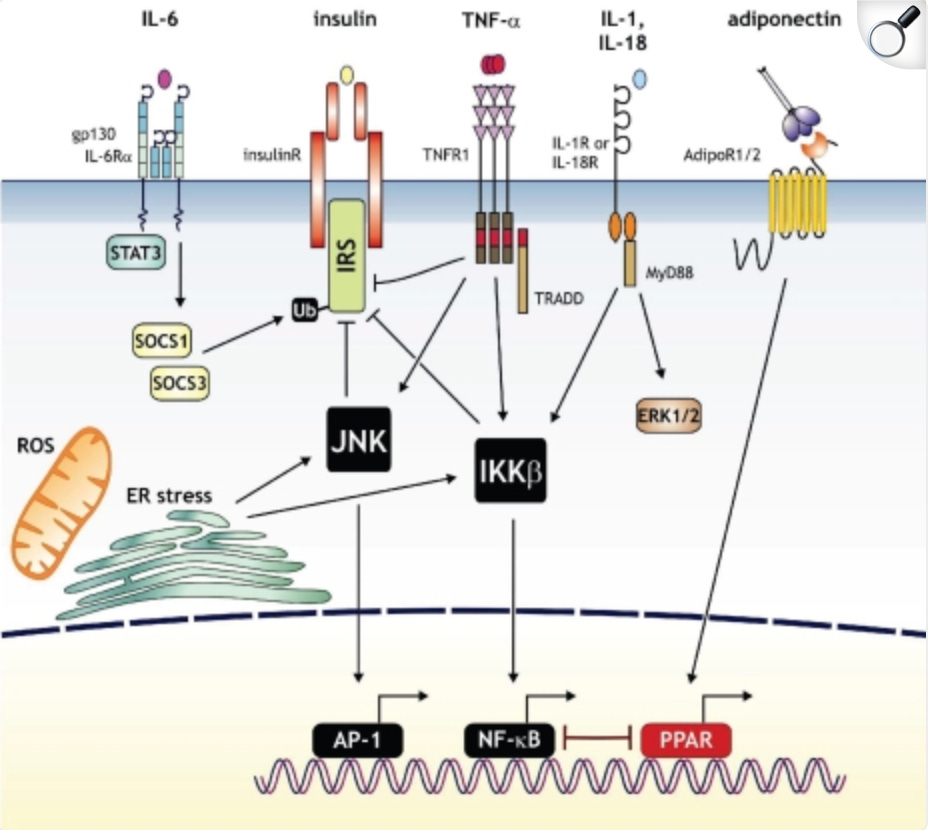
Chronic inflammation directly causes insulin resistance through multiple pathways. Inflammatory cytokines like TNF-alpha, IL-6, and IL-1beta interfere with insulin signaling at the receptor level. This driver makes the body feel reactive and fuel handling unpredictable. Some days feel fine. Others feel swollen or foggy. The immune system shifts the metabolic priority. Insulin resistance grows as a by-product of the inflammatory workload.
People with this pattern often describe “reactive days.” Rings feel tight. The face looks puffy. Weight swings by several pounds from one morning to the next. Skin flares appear and disappear. Alcohol hits harder than expected. Stress creates redness or flushing out of proportion to the moment.
Gut-derived inflammation is particularly relevant. Increased intestinal permeability (leaky gut) allows bacterial endotoxins (LPS) into circulation. LPS triggers systemic inflammation and has been directly linked to insulin resistance. The gut microbiome significantly influences this pathway.
The Lab Cluster:
• Fasting insulin 10 to 20+ µIU/mL
• CRP above 1 mg/L
• ESR often elevated
• Ferritin elevated above 150 to 200 ng/mL without iron deficiency
• White blood cell count high-normal or elevated
• Possible elevated antibodies such as thyroid or ANA
• HDL low
The Body Map:
• Puffy eyes
• Fluid retention
• Soft waist
• Weight fluctuations
• Possible inflammatory skin conditions
The Sensation:
• Joint soreness
• Headaches
• Redness during stress
• Food reactions
• Gas in waves
• Afternoon flushing
• Heaviness behind the eyes
• Poor alcohol tolerance
• Sinus issues
• Histamine sensitivity
• Autoimmune flares
Correction Path:
Identify and eliminate inflammatory triggers. Common culprits include food sensitivities, gut infections, mold exposure, chronic stress. Support gut healing. Address autoimmune triggers.
Prioritize consistent sleep
Use simple, easy meals
Reduce alcohol
Move steadily each day
Increase micronutrients like vitamin A and magnesium
Use predictable meal timing
Eat warm meals, broths
Use whole-food vitamin C sources and acerola cherry powder for additional support.
5. The Estrogen-Dominance Driver
Estrogen is a growth signal. It increases tissue building, fluid retention, and fat storage. When estrogen rises relative to progesterone, the liver has a harder time clearing hormones and maintaining stable glucose flow. High estrogen slows thyroid activity, and that slow-burn metabolism increases insulin resistance further.
People feel this pattern in their mood, their cycle, and the way they hold water. The lower body becomes the preferred storage site. Men experience chest fat and stubborn side fat. Women feel heaviness and irritation before their period. Everything feels slightly waterlogged.
The Lab Cluster:
• High insulin
• Low SHBG reflecting metabolic stress and reduced hepatic clearance
• In women, low progesterone around day 21 of the cycle
The Body Map:
• Weight gain in the hips, thighs, and buttocks
• In men, chest fat or stubborn love handles
The Sensation:
• PMS
• Heavy or painful periods
• Cyclical irritability
• A sense of heaviness
Correction Path:
1. Improve bile flow (bile removes estrogen)
2. Use carrot salad daily to help with estrogen clearance
3. Use vitamin E (mixed tocopherols)
4. Consider Progest-E if progesterone is low
Note: A full estrogen article is coming soon
6. Under-Fueling and the Depleted State
This is a flatlined system. The body has downregulated everything to conserve energy. Low insulin in this context doesn’t mean “great insulin sensitivity.” It signals a suppressed metabolism from chronic under-eating, low carbohydrates, or/and excessive training.
Low carbohydrate intake drains liver glycogen. When glycogen is low, cortisol takes over blood sugar management by breaking down muscle. This is why these individuals often have low glucose, low insulin, and high stress markers and muscle wasting.
Chronic calorie restriction reduces insulin secretion, leptin, and thyroid hormones while increasing cortisol. These hormonal changes persist even after weight is restored. Research on the Minnesota Starvation Experiment and modern replication studies shows metabolic adaptation occurs rapidly with severe restriction and can persist long-term. The body interprets chronic energy deficit as an existential threat. It prioritizes survival over reproduction, leading to hypothalamic amenorrhea in women. Cholesterol production drops, impairing synthesis of all steroid hormones (progesterone, estrogen, testosterone, cortisol, DHEA).
Low insulin with low cortisol specifically indicates adrenal fatigue or HPA axis dysfunction. The person has been running on stress hormones for so long that even the stress response has exhausted.
The Lab Cluster:
• Fasting insulin low
• Fasting glucose 65 to 75 mg/dL
• Total cholesterol below 160 mg/dL
• LDL low
• Free T3 low or low-normal
• Morning cortisol often below 8 to 10 µg/dL
• DHEA-S and progesterone low
The Body Map:
• Lean appearance
• Difficulty gaining muscle
• Very little subcutaneous fat
• May look fit but feel exhausted
• Fluid in the lower stomach at night
The Sensation:
• Heavy legs during training
• Persistent fatigue
• Cold during the day
• Forgetfulness
• Workout crashes
• Salt cravings
• Low libido
• Irregular cycles
• Low mood
• Excessive hair shedding
• Brittle nails
Correction Path:
1. Increase calories gradually
2. Increase carbohydrates and protein
3. Cut training volume significantly
4. Improve sleep
5. Reduce stress load
6. Allow months of consistent intake for recovery
7. See my repletion article for guidance
How to Read Your Own Pattern
Each driver leaves a footprint. Start by collecting your data.
Labs to Order:
• Fasting insulin
• Fasting glucose
• Complete lipid panel
• Full thyroid panel
• Morning cortisol
• Liver enzymes
• CRP
• Complete blood count
• Progesterone
• FerritinMeasure Body Composition:
• Waist circumference
• Waist to height ratio
• Waking and afternoon temperature
• Fat distribution pattern
• Note where you carry fatDocument symptoms:
• Sleep quality and timing of wake-ups
• Energy patterns through the day
• Temperature regulation
• Digestion
• Mood
• Exercise recovery
• Menstrual regularity
• Stress tolerance
Review your history:
• Dieting patterns and duration• Exercise patterns (type, volume, intensity and frequency)
• Major stress periods
• Illness or infections exposures
• Medication historyLook for clustering: Which pattern do your markers group into? You might see elements of multiple patterns. For instance, stress-driven insulin resistance often overlaps with thyroid suppression. Fatty liver often coexists with inflammation or/and impaired estrogen clearance. The pattern that fits best tells you where to focus first.
Track your data over time. One lab draw is only a snapshot. The pattern becomes clear when you watch markers shift in response to your actions. If sleep improves and insulin drops, you learned something. If food intake rises and Free T3 increases, you learned something. If triglycerides fall after removing seed oils (it may take some time), you learned something.
Your body responds to interventions. Track the response. That teaches you the mechanism. This is how I recovered my health.
Final Notes
These patterns organize information so you can form clear hypotheses. They point toward mechanisms. As I mentioned already, you might not fit perfectly into one box. Patterns overlap. You might have stress-driven insulin resistance with thyroid suppression and mild fatty liver. That’s common. Address the primary driver first, then reassess.
Context is everything.
insulin level of 12 means something very different in a lean, active 25-year-old woman recovering from overtraining than in a sedentary 55-year-old man with visceral obesity. The number exists within a story.
REMEMBER: Labs lag behind physiology. You might feel better or worse before labs change significantly. Trust symptoms, but verify with objective data over time.
Insulin resistance is reversible in most cases.When you address the driver, insulin normalizes. Sometimes quickly, sometimes slowly. The body wants to be metabolically healthy. Remove the chronic insult and it recovers.
REFERENCES
Holt HB, Wild SH, Postle AD, et al. Cortisol clearance and associations with insulin sensitivity, body fat and fatty liver in middle-aged men. Diabetologia. 2007;
Anagnostis P, Athyros VG, Tziomalos K, et al. The pathogenetic role of cortisol in the metabolic syndrome: a hypothesis. J Clin Endocrinol Metab. 2009;
Yun JE, Won S, Kimm H, et al. Perceived stress and non-alcoholic fatty liver disease in apparently healthy men and women. Sci Rep. 2020;
Mullur R, Liu YY, Brent GA. Thyroid hormone regulation of metabolism. Physiol Rev. 2014;
Croxson MS, Hall TD, Kletzky OA, et al. Decreased serum thyrotropin induced by fasting. J Clin Endocrinol Metab. 1977.
Brenta G. Why can insulin resistance be a natural consequence of thyroid dysfunction? J Thyroid Res. 2011.
De Pergola G, Ciampolillo A, Paolotti S, et al. Free triiodothyronine and thyroid stimulating hormone are directly associated with waist circumference, independently of insulin resistance, metabolic parameters and blood pressure in overweight and obese women. Clin Endocrinol (Oxf). 2007.
Amouzegar A, Kazemian E, Gharibzadeh S, et al. Association between thyroid hormones, thyroid antibodies and insulin resistance in euthyroid individuals: a population-based cohort. Diabetes Metab. 2015.
Kumashiro N, Erion DM, Zhang D, et al. Cellular mechanism of insulin resistance in nonalcoholic fatty liver disease. Proc Natl Acad Sci U S A. 2011;
Fabbrini E, Sullivan S, Klein S. Obesity and nonalcoholic fatty liver disease: biochemical, metabolic, and clinical implications. Hepatology. 2010.
Li Y, Liu L, Wang B, et al. A vicious circle between insulin resistance and inflammation in nonalcoholic fatty liver disease. Lipids Health Dis. 2018.
Müller MJ, Enderle J, Pourhassan M, et al. Metabolic adaptation to caloric restriction and subsequent refeeding: the Minnesota Starvation Experiment revisited. Am J Clin Nutr. 2015.
Dulloo AG, Jacquet J, Montani JP. How dieting makes some fatter: from a perspective of human body composition autoregulation. Proc Nutr Soc. 2012.
Hotamisligil GS. Inflammation and metabolic disorders. Nature. 2006;444(7121):860-867.
Tilg H, Moschen AR. Inflammatory mechanisms in the regulation of insulin resistance. Mol Med. 2008.
Li Y, Liu L, Wang B, et al. A vicious circle between insulin resistance and inflammation in nonalcoholic fatty liver disease. Lipids Health Dis. 2018;
Very interesting! Where does low carb high fat land on this for you? I have been on a mainly carnivore diet and I’ve resolved a lot of issues: allergies, tendonitis, and high blood pressure. But, my HbA1c started to go up, which surprised me. I attributed it to finishing my residency, and I have to take new tests now that I have gotten my circadian rythm in shape (or at least better). If it where to continue to be high, where would yo go? I find this very interesting, and thanks for the information provided! I know its a lot, but if you want to chat I’d love to do it
Τhank your for sharing, excellent, simple to understand and follow.🙏